SocialChartsSocialCharts
MarketsFeedTradeTerminalTradersLearnMy accounts
SocialChartsSocialCharts
SocialCharts is free and earns referral revenue from partner brokers in eligible countries. Rankings are not investment advice. Past performance does not guarantee future results.
© 2026 SocialChartsMethodologyVisionPrivacyTermsSettings
▶From YouTube to SocialCharts

You saw it live. Now take a closer look.

Find the strategy that caught your eye. Explore its trades, returns and risk together.

Start exploring:
Explore strategies →Explore the market
No account needed to exploreFree to follow
Mi

Mimosa

AUDUSD · EURUSD · multi-symbol strategy

Historical test
Return over the full record⁦+210.60%⁩
Last 365 days⁦+9.91%⁩
Last 365 days of the record · starts at 100
Trades
4,305
Max drawdown
6.15%
Profit factor
1.30
Explore its trades and the chart↗
Trade histories and chartsRisk shown next to every returnNews and expert viewsYour own trades, analysed
◎Your next discovery

Choose a strategy. Explore its track record.

Open its trades, weigh returns against maximum drawdown, and see how it works.

Mi

Mimosa

AUDUSD · EURUSD
Record return⁦+210.60%⁩Max drawdown6.15%Trades4,305
Historical testOpen profile ↗
Ve

Vega

AUDUSD · EURUSD
Record return⁦+218.90%⁩Max drawdown6.99%Trades4,093
Historical testOpen profile ↗
Az

Azucena

AUDUSD · USDCAD
Record return⁦+175.79%⁩Max drawdown6.91%Trades4,378
Historical testOpen profile ↗
Co

Concordia

Portfolio · 8 strategies with set weights

DemoHistorical test
Return
⁦+370%⁩
Max DD
7.27%
Win weeks
72%
Strategies
8
Weights
Verbena14%
Bambú14%
Vega14%
+ 5 more strategies58%
Follow · freeAll 17 portfolios
Explore all 8,396 strategies →
▣Inside SocialCharts

Open a profile. See the full picture.

Take a look at strategy profiles and market pages.

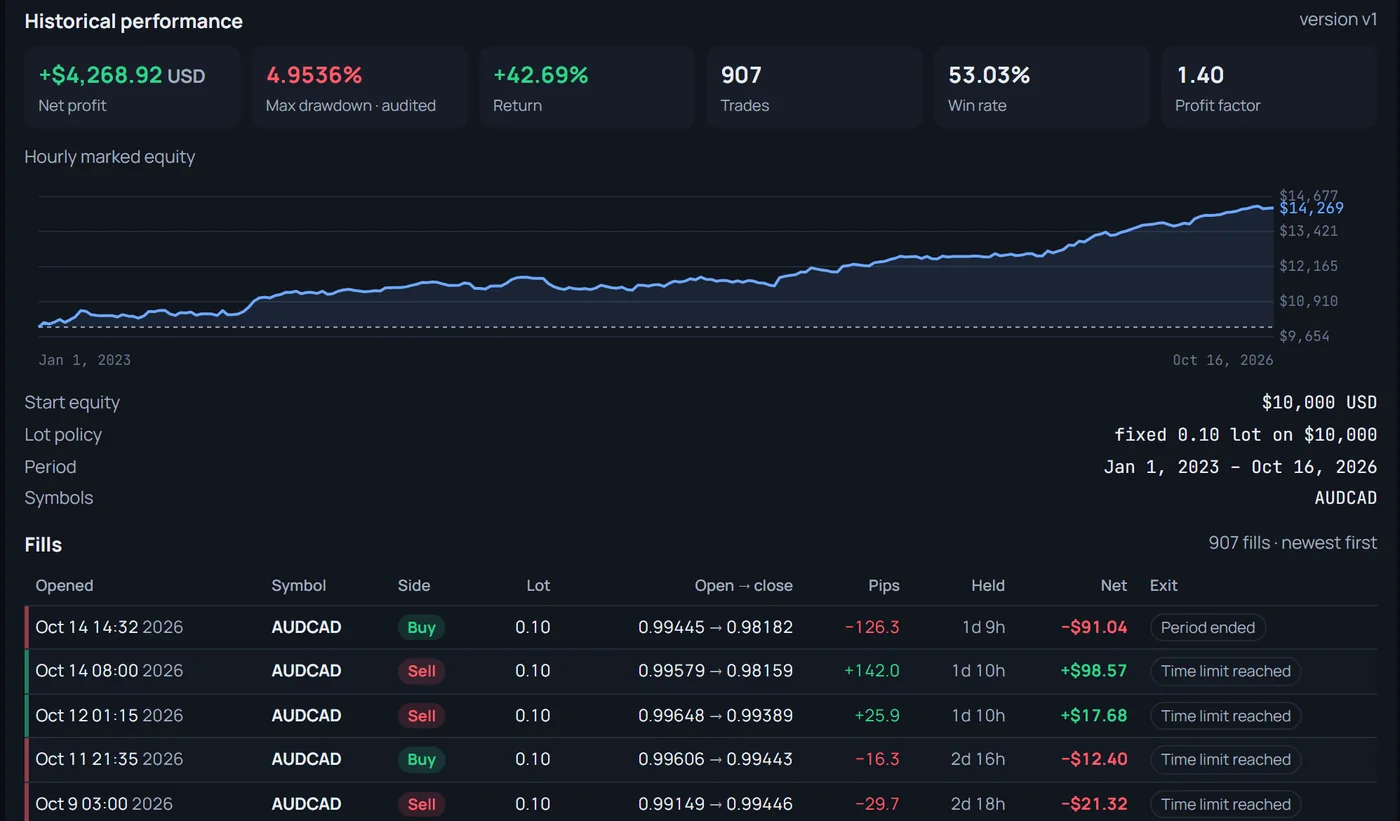
A strategy’s track record, in one profile.

  • Account performance over time
  • Every fill with entry, exit, pips and result
  • Returns, maximum drawdown and trading statistics side by side
Open a strategy profile ↗
socialcharts.net/trader
Strategy profile: historical performance, account curve and trade list
?Your livestream guide

Learn the signals. Follow the stream with confidence.

Tap the numbers in this example to understand the rows and symbols shown in the livestream.

A decision on the tape
10:00:58Willow AntaresGBP/USDBuy · Open1.33108
10:01:00MizarEUR/JPYClose ▲175.868
Strategies by symbol
GBP/USD53%▲1 ▼5
⌇The bigger market picture

What's behind the price?

Every market has one page: the chart with the news on its timeline, sourced briefs, the economic calendar, published ideas and where the strategies stand.

NNews on the timelineEach marker opens the brief and the price move after it.
◉Ideas with a target and an invalidationBoth are recorded when the idea is published, then the market decides.
✦Briefs that show their sourcesEach brief links to the statements and reports it is based on.
▦The economic calendarHigh-impact releases with forecast, previous and actual.
Open EUR/USDOpen the market feed
◎Expert forecasts14 gold views · 9 teams

What do the experts expect for gold?

Bank and analyst targets, each with its own date, period and source. When a view changes, the earlier one stays on record.

Goldman Sachs Research · End of 2026 · Sep 21, 20264,900→4,650▼ Lowered
See all gold views on the map →
The newest viewsfrom today's 3,956.00
J.P. Morgan Private Bank · Yuxuan TangEnd of 2027 · price5,000⁦+26.4%⁩
Sucden FinancialBy mid-January 2027 · range4,200–4,300~⁦+7.4%⁩
State Street · Aakash DoshiEnd of Q1 2027 · range4,750–5,500~⁦+29.6%⁩
CIBC Capital MarketsFull year 2027 · average5,200⁦+31.4%⁩
◔Your own trading

Know your trades. Discover your habits.

See which hours and markets bring you better results.

Upload a statement or connect MT4/MT5 in read-only mode with your investor password. Analyse your trades and view your accounts in one place. Your analysis stays private.

MT4 / MT5Statement uploadPrivate analysisHours and symbolsSeveral accounts
Explore account analysis →

Result by weekday and hour

Illustrative example · UTC
000204060810121416182022MonTueWedThuFri
Stronger hours in this example: Net results are higher between 07:00 and 11:00 UTC.
Weaker hours in this example: Trades after 20:00 UTC reduce the net result.
☆Free account

Keep your favourites within reach.

Bring strategies, portfolios and markets together in your watchlist, ready for your next visit.

MiMimosastrategy · AUDUSD, EURUSD⁦+210.60%⁩
CoConcordiaportfolio · 8 strategies⁦+370%⁩
AuGold · expert views14 views3,956.00
Create my watchlist →

Prefer email?

Get your choice of updates on strategies, markets and changing expert views by email. We will let you know when the newsletter launches.

We use your address only for the newsletters you choose. Privacy policy

?Questions

Before you start.

Short answers to what people ask when they come from the stream.

Are the strategy results real trades?

Strategies labelled Demo show historical tests and simulated tracking results. Profiles with real-account performance are identified separately.

What does following do?

Keep profiles within easy reach and see their new posts in your feed. Following does not start copying trades to your account.

Where do the expert forecasts come from?

From bank and analyst research reported in public sources. Each view shows who published it, when, for which period, and links to the source.

Can SocialCharts trade on my account?

Not with the investor password. That connection is read-only: it reads your history and positions for the analysis and cannot place, change or close a trade.

Not investment advice. Past and simulated results do not guarantee future results. Leveraged products such as CFDs and forex can lose value quickly.
Find a strategyWatchlist