How to Read Candlestick Charts: A Beginner’s Guide with Real Gold Prices
Every candle on a chart is a short story about one period: where it opened, how far it went and where it closed. Here is how to read that story, on real gold prices.
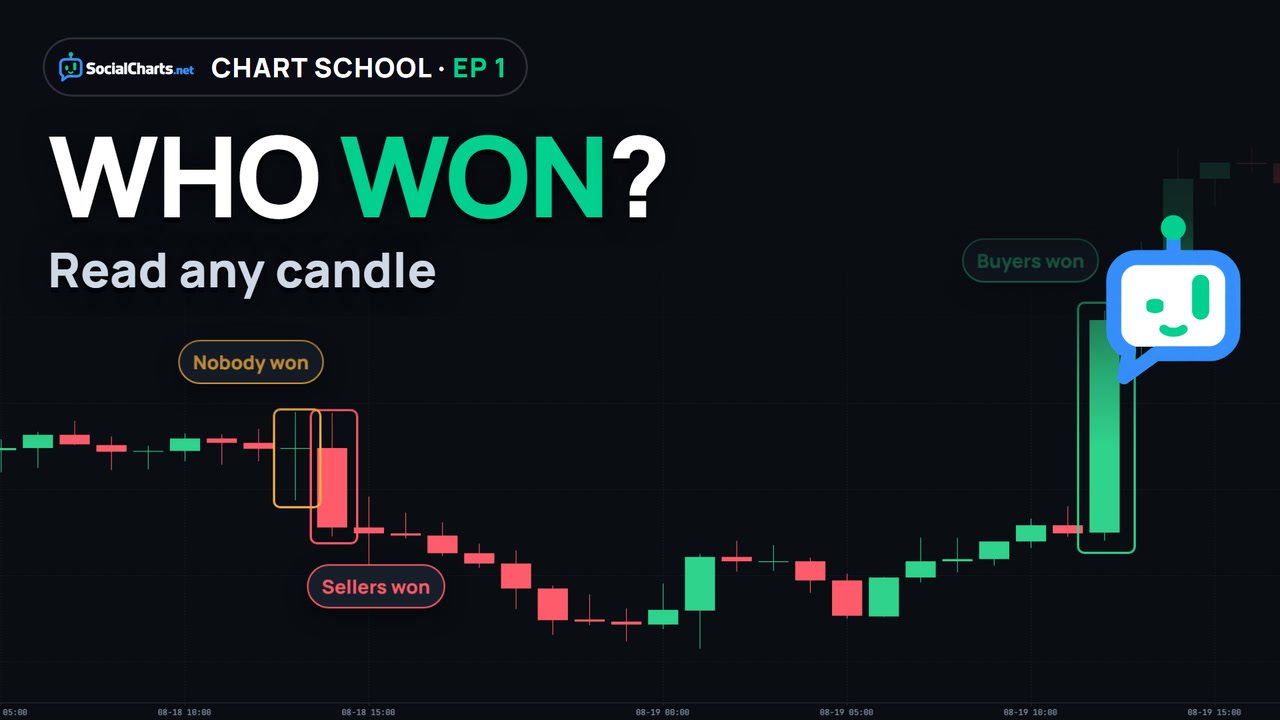
A candlestick shows four prices for one period: the open, the high, the low and the close. The thick body runs from the open to the close: green if price closed higher, red if it closed lower. The thin wicks mark prices the market reached but could not hold. Read the body, then the wicks, then the sequence, and wait for the candle to close.
What a chart shows
Every price chart answers two questions: what was the price, and when? The vertical axis on the right is price. The horizontal axis along the bottom is time.
The simplest way to draw a market is a line that connects the closing price of each hour. But a line keeps only the last price of every hour and throws away everything in between. On August 24, 2026, one hour of gold looked almost flat on a line chart. Inside that hour, gold actually travelled about $46 between its high and its low.
A candlestick chart keeps that information. Same market, same hours, but each candle stores four prices.
Anatomy of a candle
- Open: where the period started.
- High: the highest price it reached.
- Low: the lowest price it reached.
- Close: where the period ended.
The thick part between the open and the close is the body. The thin lines above and below are the wicks, also called shadows. They mark prices the market visited but could not hold.
A candle is green when it closed higher than it opened: buyers ended the period ahead. It is red when it closed lower: sellers ended ahead. Colors differ between platforms, but the rule never changes: compare the close with the open.
The most important idea: a candle is a summary. One one-hour candle is sixty one-minute candles put together. On August 19, 2026, from 13:00 to 14:00 UTC, gold first dipped (that dip became the lower wick), then rose past the open to the high, then slipped back a little before the hour ended (that pullback became the upper wick).
Reading bodies and wicks
Ask two questions about every candle: how big is the body, and how long are the wicks? Here are four real one-hour gold candles, each shown with the hours around it.
So every candle answers three questions: who won the period (the body), what was rejected above (the upper wick) and what was rejected below (the lower wick).
Timeframes
On the one-hour chart, August 18, 2026 was hour after hour of red: gold fell about $93 in one day, from 4425.74 to 4332.96. If that is all you look at, it feels like a collapse.
On the daily chart, where every candle is one full day, that whole red sequence is one candle inside a bigger picture. A daily candle summarizes that day’s hourly candles: the open is the first hour’s open, the close is the last hour’s close, and the wicks show the day’s highest and lowest prices.
Neither view is wrong. The one-hour chart shows the day; the daily chart shows the month. Every timeframe is the same data at a different zoom level.
Reading a sequence
Single candles are words; the real story is in the sentence. On the four-hour gold chart from August 19 to 28, 2026:
- Strong trend: a long green body starts the move. More green candles follow, with each close higher than the last. Buyers won several periods in a row.
- The fight gets harder: the bodies get smaller and the upper wicks longer. Price is still near the highs, but every push higher meets selling.
- Control changes: big red candles appear. Over the next two days, most four-hour candles close lower than they open. On Friday, August 28, two large red candles appear in a row.
Candles describe. They don’t predict. None of these shapes told us what would happen next. Your job is to read who is in control, and to notice when that changes.
4 beginner mistakes
- Judging one candle on its own. The September 1 candle with the long lower wick showed buyers stepping in. The rest of that day, gold kept falling and closed near its lows, around 4,325. One candle is one period, not a forecast.
- Reading a candle before it closes. On August 18 at 14:00 UTC, the one-hour candle was green for most of its first half hour. Then it turned and closed red. Until a candle closes, it can still change.
- Forgetting the timeframe. The same day was a collapse on the hourly chart and one red candle on the daily. Always check which timeframe you are looking at.
- Trusting colors blindly. Some platforms use other colors, or draw bars instead of candles (a tick on the left for the open, on the right for the close). What matters is where the period opened and where it closed.
Recap and practice
Five habits:
- Zoom out first.
- Read the body: who won?
- Read the wicks: what was rejected?
- Read the sequence, not a single candle.
- Wait for the close.
Practice: open any chart on SocialCharts, find the longest wick of the week, and ask yourself what was rejected there.
Next in Chart School: support and resistance, the places where those wicks keep showing up.
Frequently asked questions
What do green and red candles mean?
Green means the period closed higher than it opened; red means it closed lower. Some platforms use other colors, so always compare the close with the open.
What is a wick?
The thin line above or below the body. It marks prices the market reached during the period but could not hold until the close.
What is a doji?
A candle with a very small body: it closed almost where it opened. Buyers and sellers both tried, and neither won that period.
Which timeframe should a beginner start with?
Start by zooming out to the daily chart to see the bigger picture, then zoom in. Every timeframe is the same data at a different zoom level.
Can candles predict the next move?
No. Candles describe what happened in each period. They help you read who is in control, not what comes next.
Read real candles now
Open the gold chart, switch between the 1-hour and daily views, and find the longest wick of the week.
Keep learning
 Gold Playbook · 1When Does Gold Move the Most? Gold’s Busiest Hours, Measured
 Trading Terms · 1What Is a Pip in Forex and Gold? Real Examples
Educational content only, not investment advice. Trading CFDs and forex involves a high risk of losing money.