How to Find Support and Resistance: A Beginner’s Guide with Real Charts
Markets seem to remember prices. One gold zone stopped price in December 2025 and again ten months later. Here is how to find such zones and read what happens at them.
Support is a price area where falling prices stopped; resistance is a price area where rising prices stopped. Find them on the daily chart where several clear turns cluster, draw them as zones rather than single lines, and judge a break by the close, not the wick. A broken resistance can become support, and a broken support can become resistance.
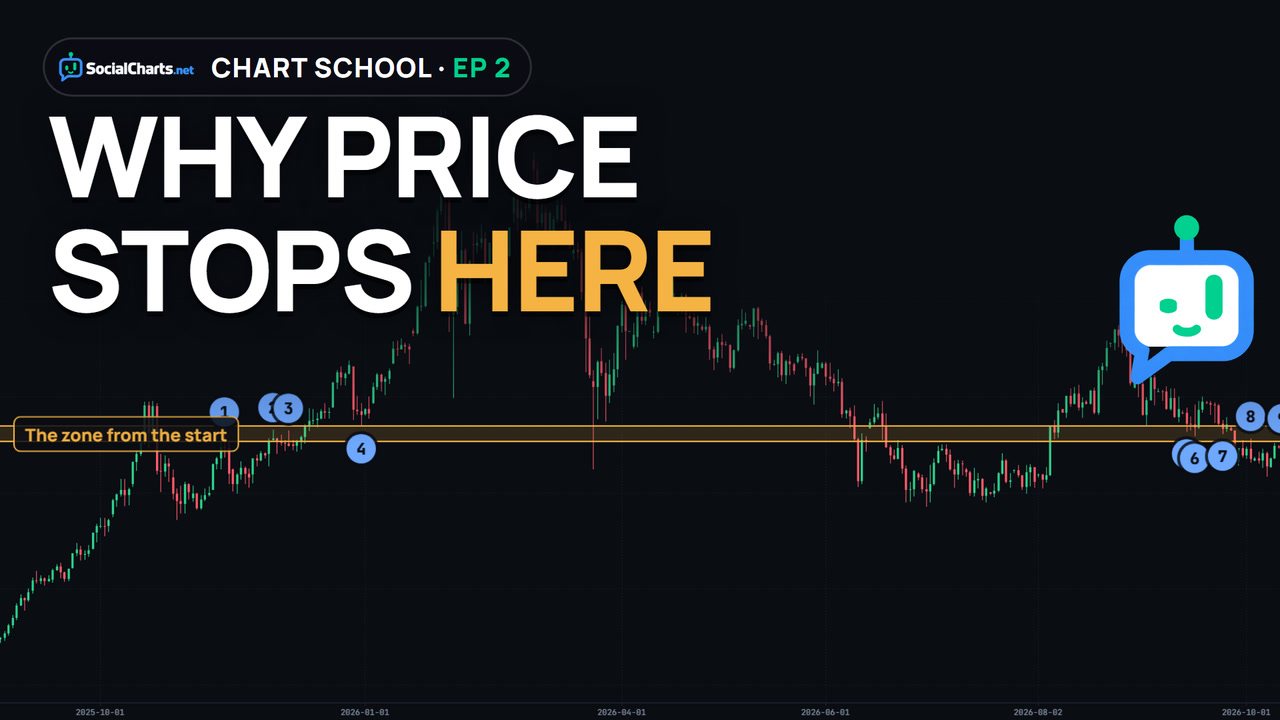
What support and resistance are
Start with a calm market: EURUSD in the summer of 2026. For about five weeks, every drop stopped in the same area, around 1.135. That is support: a floor where falling prices stopped. Every rise stopped around 1.147. That is resistance: a ceiling where rising prices stopped. Price bounced between the two like a ball in a box. Traders call this a range.
Look closer and the tops are upper wicks, the bottoms lower wicks. A wick is a price that was tried and rejected. When wicks line up at the same level, that price keeps getting rejected.
Why they work
Think about the people who traded at a level. Some sold near the ceiling. Some wanted to buy but missed the move. Some told themselves they would sell if price ever came back. When price returns, many of them act at the same place at the same time. Round numbers draw attention too: 4,250 sits near the middle of the gold zone below, and round numbers are easy to remember.
A zone tells you where to pay attention, not what to do. It is not magic, and it does not always work.
Zones, not lines
Most beginners draw a single line, say at 4,250 on gold. Some tops turn back before the line, others poke through it. Markets rarely turn at exactly the same price. So draw a zone instead, from about 4,210 to 4,280: the turns fall in or near this area. That zone is about $70 wide, less than 2% of the price. On a daily chart a zone is usually a little wider; on a one-hour chart, narrower.
How to find them: a 4-step routine
- Zoom out. On the one-hour chart you see dozens of small turns; on the daily chart most of that noise is gone.
- Mark the clear turns: the places where the direction changes.
- Find where the turns cluster at the same height.
- Keep two to four zones. If everything is a level, nothing is.
Do this on gold’s daily chart over a whole year, and one area keeps showing up: nine clear turns in or near the zone from 4,210 to 4,280, almost a year apart.
When roles flip
In December 2025 the zone was a ceiling for weeks. On December 11, gold pushed into the top of the zone; on December 12 it closed clearly above it, at 4,299.52. Later that month price came back down, and on December 31 it touched the top of the zone (low 4,273.78) and turned up again. The old ceiling became a floor. Traders call this a role reversal.
It works the other way too. In September 2026 the same zone was a floor. On September 28, gold closed well below it. On the way back up, where might it struggle? Right at the old floor: in October, gold rose back toward the zone three times and turned down each time. The old floor became a ceiling.
Real vs fake breaks
On September 16, 2026, gold dipped to 4,235.21 during the day, inside the zone. It also closed inside, at 4,271.68. That was a test of support: both the low and the close stayed inside the zone.
On September 28, gold closed at 4,127.40, more than $80 below the zone. That was a real break.
Same lesson on EURUSD: on September 29, 2026, the wick dropped below the old floor but the candle closed back inside. Two days later, on October 1, it closed clearly below. Some traders also wait for a second close, or for price to come back and test the zone from the other side. There is no perfect rule, but the close is the first thing to check.
4 common mistakes
- Drawing too many lines. If you mark every bump, the chart turns into noise again. Two clear zones say more than fifteen lines.
- Treating a level as one exact price. It is an area. Give it room.
- Believing a zone will always hold. The September floor held for two weeks, then broke. Zones break; that is normal.
- Seeing a level in every small turn. On the one-hour chart you can find a new one every few hours. Start from the daily chart, then zoom in.
Recap and practice
- Zoom out first.
- Mark the clear turns.
- Draw zones, not lines.
- Wait for the close.
Practice: open EURUSD on SocialCharts, switch to the daily chart, and find two zones where price turned more than once.
Wicks are the key to all of this; if they are new to you, read How to Read Candlestick Charts first.
Frequently asked questions
What is the difference between support and resistance?
Support is an area where falling prices stopped; resistance is an area where rising prices stopped. The same area can play both roles at different times.
Is support or resistance one exact price?
No. Markets rarely turn at exactly the same price, so mark a zone. On gold’s daily chart, the example zone was about $70 wide.
How many zones should I draw?
Two to four clear zones on the daily chart are enough. If every small turn is a level, nothing stands out.
How do I know if a break is real?
Check the close first. A wick through a zone that closes back inside is often a fake break; a clear close beyond the zone is a stronger sign. There is no perfect rule.
Do support and resistance always work?
No. Zones break, and that is normal. A zone tells you where to pay attention, not what to do.
Find two zones yourself
Open EURUSD, switch to the daily chart, and find two zones where price turned more than once.
Keep learning
 Gold Playbook · 1When Does Gold Move the Most? Gold’s Busiest Hours, Measured
 Trading Terms · 1What Is a Pip in Forex and Gold? Real Examples
 Chart School · 1How to Read Candlestick Charts: A Beginner’s Guide with Real Gold Prices
Educational content only, not investment advice. Trading CFDs and forex involves a high risk of losing money.