What Happens to Gold on Jobs Day? 5 Real NFP Releases, Minute by Minute
The monthly US jobs report can move gold sharply. We looked at the last five releases, minute by minute, to see what gold really does.
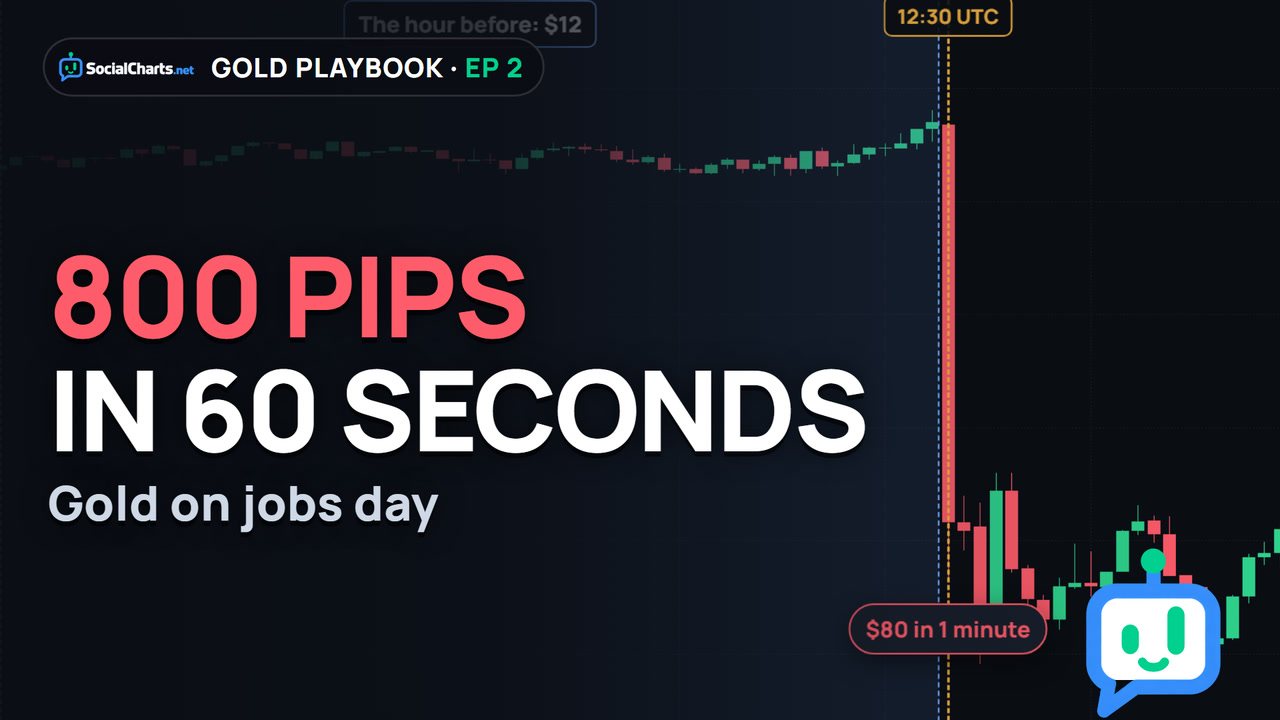
In the last five US jobs reports (June to October 2026), gold’s high-to-low range was between $18 and $80 in the first minute. Four times out of five, the first five minutes went the "textbook" way (more jobs than forecast, gold down; fewer, gold up), and four times out of five gold was still on the same side of its starting price four hours later. On jobs days, gold’s average range in the 12:00 UTC hour was $74, against $26 on other days.
What the jobs report is
The jobs report, also called Nonfarm Payrolls (NFP), tells us how many jobs the US economy added last month, outside farming. It usually comes out on the first Friday of the month at 8:30 in New York: 12:30 UTC in summer and 13:30 UTC in winter.
Before it comes out, economists publish a forecast. The difference between the actual number and the forecast is the surprise, and markets react to the surprise.
Why does gold care about American jobs? Strong jobs can mean higher US interest rates and a stronger dollar, and gold often falls. Weak jobs can mean the opposite. Often, not always.
The calm before
In four of the five reports, the hour before the release was quiet: gold’s high-to-low range was only $11 to $14. On September 4, just $12 in that whole hour. Then the number came out, and everyone reacted at the same moment.
The first minutes
| Release | Surprise (jobs) | 1st minute range | First 5 min | 4 hours later |
|---|---|---|---|---|
| 2026-06-05 | +95k | $18 | −$12 | −$135 |
| 2026-07-02 | +14k | $59 | +$62 | +$51 |
| 2026-08-07 | −64k | $45 | +$50 | +$28 |
| 2026-09-04 | +121k | $80 | −$79 | −$39 |
| 2026-10-02 | −23k | $41 | +$36 | −$50 |
Gold’s moves are measured from 12:30 UTC. Surprise = actual minus forecast, in thousands of jobs.
In the first minute alone, gold’s high-to-low range was between $18 and $80. Look at the signs: when jobs beat the forecast, gold mostly went down; when they missed, gold went up. The biggest surprises, +95k and +121k jobs, brought the biggest drops in the first five minutes.
Did gold follow the textbook?
In four of five reports, the first five minutes went the textbook way. The exception was July 2: jobs beat the forecast, but only by 14,000, and gold jumped $62 in five minutes. Up, not down.
A small surprise can go either way. The textbook direction is a tendency, not a rule.
Did the first move last?
Four times out of five, gold’s move after four hours was in the same direction as its move after five minutes. But on October 2, jobs missed the forecast and gold jumped $36 in five minutes. Four hours later it was $50 below where it started. The first move does not always last; sometimes it is the opposite of what comes next.
The whole hour
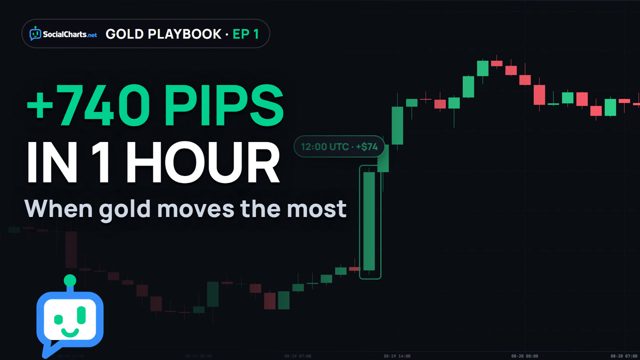
On jobs report days, gold’s average high-to-low range in the 12:00 UTC hour was $74. On other days, only $26: the range was about three times as large on jobs days. That is the Friday effect from When Does Gold Move the Most?
What to take away
- The surprise matters more than the number.
- The first move does not always last.
- Five reports is a small sample: treat these as clues, not rules.
- In winter, the report comes at 13:30 UTC.
The next release date is in the economic calendar next to every chart on SocialCharts.
Frequently asked questions
What is NFP?
Nonfarm Payrolls: the number of jobs the US economy added in the past month, outside farming. It is the headline of the monthly US jobs report.
What time is the jobs report?
Usually the first Friday of the month at 8:30 in New York: 12:30 UTC in summer and 13:30 UTC in winter.
Does a strong jobs report always push gold down?
No. In four of the last five reports, gold first moved the textbook way, but on July 2, 2026 a small beat came with a $62 jump.
Does the first move last?
Often, but not always. On October 2, 2026, gold rose $36 in five minutes and was $50 below its starting price four hours later.
See the next jobs report coming
Open gold: the economic calendar next to the chart shows the date and time of the next US jobs report.
Keep learning
 Trading Terms · 2Long vs Short: Buying and Selling Explained
 Chart School · 2How to Find Support and Resistance: A Beginner’s Guide with Real Charts
 Gold Playbook · 1When Does Gold Move the Most? Gold’s Busiest Hours, Measured
Educational content only, not investment advice. Trading CFDs and forex involves a high risk of losing money.