How to Identify a Trend: Swing Highs, Swing Lows and When Trends End
A trend is a staircase of swings. Here is how to read it, and how to notice when it starts to break, on real gold and EURUSD prices.
Mark the clear swing highs and swing lows, then compare highs with highs and lows with lows. Higher highs and higher lows make an uptrend; lower highs and lower lows make a downtrend. An uptrend may be weakening when candle shapes change and price makes no new high. Its staircase breaks when price closes below the last higher low: gold did that on June 5, 2026, at 4,328.
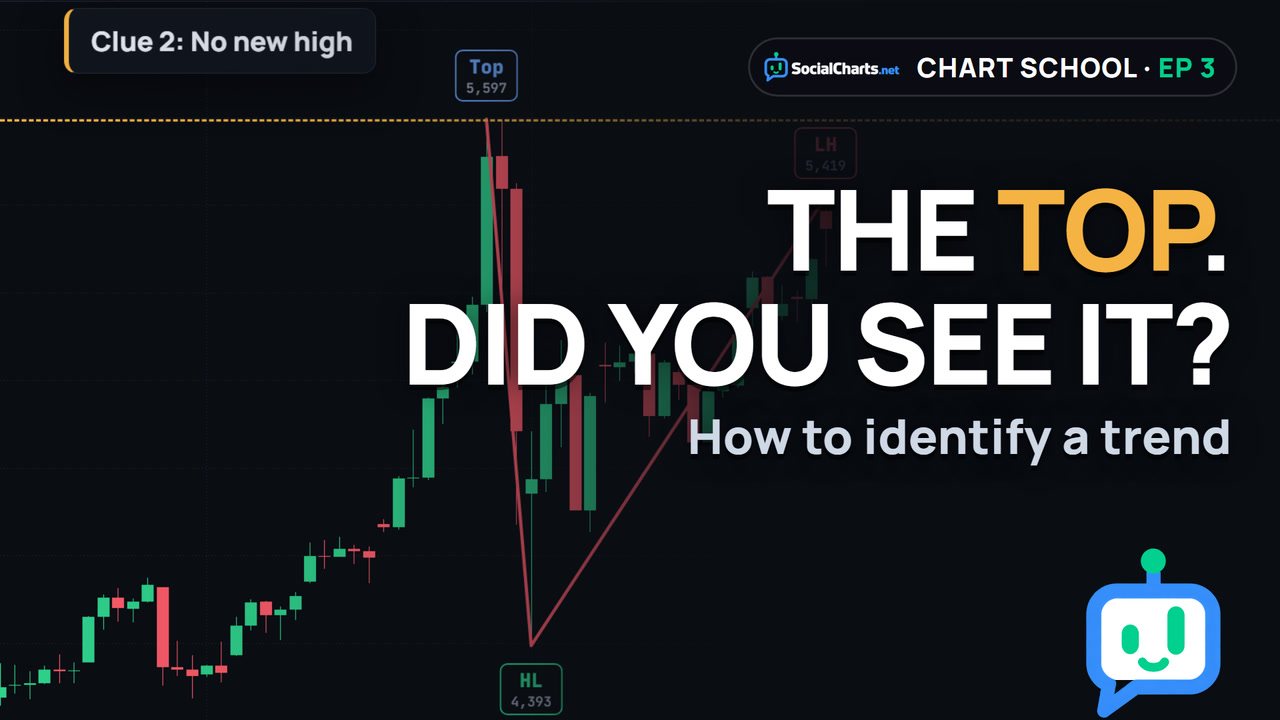
From November 2025 to January 2026, gold climbed from about 4,000 to almost 5,600. Then, in three days, it lost about $1,200. Could you have seen the end coming? The candles left clues. This lesson shows how to read a trend, and how to notice when it is running out of steam.
What a trend is
A market can do three things. It can go up, it can go down, or it can go sideways, like the EURUSD range of summer 2026 in the support and resistance lesson. When it goes in one direction for a while, that is a trend.
Here is EURUSD in the spring of 2025. Price climbed like a staircase. Every dip stopped higher than the last one, and every rise went further. That staircase is what a trend looks like.
Swings: highs and lows
To read a trend, first mark the swings.
- A swing high is a peak where price clearly turned down. It is one of the clear turns from the support and resistance lesson.
- A swing low is a dip where price clearly turned up.
Now compare them, one by one, on the chart above. Each swing high is higher than the one before: a higher high. Each swing low is higher than the one before: a higher low. Four higher highs, four higher lows.
Higher highs and higher lows: that is an uptrend. Compare highs with highs, and lows with lows.
Uptrends and downtrends
Gold from November 2025 to January 2026 shows the same staircase, only steeper. A higher low on November 18 (3,997.92), a higher high on December 26 (4,549.52), a higher low on New Year’s Eve (4,273.78), and a much higher high on January 28 (5,596.68). As long as the staircase keeps going, the uptrend is intact.
A downtrend is the mirror image. From April to the end of June 2026, every rally in gold stopped lower than the one before, and every drop went lower: three lower highs (LH) and two lower lows (LL).
Lower highs and lower lows: that is a downtrend.
When a trend runs out of steam
How can you tell when a trend is running out of steam? Back to gold’s top in January 2026. Here are three clues.
Clue 1: the shapes change
On January 28, gold formed a big green candle with a high of 5,596.68. The next day, it reached almost the same high (5,594.77), but the body was tiny: about 14% of the candle. Buyers pushed the price up, but could no longer keep it near the high. Then, on January 30, a big red candle: price fell from an open of 5,437.68 down to a close at 4,884.23.
That alone does not end a trend. So watch what happens next.
Clue 2: no new high
Gold bounced back, and in early March it climbed to 5,418.77. A strong rally, but it stopped below the top of 5,596.68. For the first time in months: a lower high.
Clue 3: the last higher low gives way
The last higher low was 4,393.49, on February 2. What would tell you that the uptrend is over? A close below it.
On March 23, gold dropped to 4,097.51 during the day, but closed back above, at 4,440.62. By the rule from the support and resistance lesson, that is a warning, not a break. The close below came on June 5, at 4,328.32. By then the staircase was clearly going down: lower highs and lower lows.
Traders call a close below the last higher low a break of structure. The clues came early. The confirmation came on a close.
When a downtrend ends
The end of a downtrend looks the same, upside down. At the end of June 2026, gold made a low at 3,942.40. In mid-July, the next low stopped a little higher, at 3,959.71: a first hint of a higher low.
The last lower high was 4,202.84, on July 6. On August 5, gold closed above it, at 4,278.00. The downtrend was over. Three weeks later, gold was near 4,700.
A trend ends when its staircase breaks. Wait for a close beyond the last swing, not just a wick.
3 common mistakes
1. Calling the end too early
Back to EURUSD in 2025. In late July it made a lower high (1.17889 on July 24, below the 1.18303 of July 1). Then, at the end of the month, it closed below the last higher low of 1.14460. Every clue from this lesson was there. The trend looked finished. Then it turned around and made a new high in September, at 1.19188.
A broken staircase is a warning, not a verdict. Markets do not owe anyone a reversal.
2. Mixing up timeframes
On the one-hour chart, gold was clearly falling in the last week of August 2026: from 4,696.56 on August 25 to 4,396.39 on August 31. On the daily chart, the same days are just a pullback inside the uptrend that followed the August 5 break.
Both are true. So decide which timeframe you are reading before you call a trend.
3. Treating every wiggle as a swing
On a one-hour chart, price turns every few hours. Mark only the clear turns, the ones you would see from across the room. Fewer swings, clearer story.
Recap and practice
- Mark the clear swings.
- Compare highs with highs, and lows with lows.
- Watch the shapes near the top.
- Confirm on a close.
Practice: open EURUSD on SocialCharts, switch to the daily chart, and mark the last four swings. Is the staircase going up, down or sideways?
The candle shapes from clue 1 come from How to Read Candlestick Charts. Next in Chart School: candlestick patterns, put to the test.
Frequently asked questions
How do you identify an uptrend?
Mark the clear swing highs and swing lows. If each swing high is higher than the one before and each swing low is higher than the one before, the market is in an uptrend.
What is a swing high and a swing low?
A swing high is a peak where price clearly turned down. A swing low is a dip where price clearly turned up. Mark only the clear turns, not every small wiggle.
How do I know when a trend is ending?
Watch for clues: candle shapes change near the top, a rally fails to make a new high, and finally price closes below the last higher low. A wick below it is a warning; a close below it is the confirmation.
What is a break of structure?
In an uptrend, a close below the last higher low. In a downtrend, a close above the last lower high. Gold closed below its last higher low on June 5, 2026, and above its last lower high on August 5, 2026.
Can a trend continue after the staircase breaks?
Yes. EURUSD closed below its last higher low in July 2025 and still made a new high in September. A broken staircase is a warning, not a verdict.
Read the staircase yourself
Open EURUSD, switch to the daily chart and mark the last four swings. Is the staircase going up, down or sideways?
Keep learning
 Gold Playbook · 2What Happens to Gold on Jobs Day? 5 Real NFP Releases, Minute by Minute
 Trading Terms · 2Long vs Short: Buying and Selling Explained
 Chart School · 2How to Find Support and Resistance: A Beginner’s Guide with Real Charts
Educational content only, not investment advice. Trading CFDs and forex involves a high risk of losing money.