How Did Jesse Livermore Make $100 Million in the 1929 Crash?
He profited from the 1929 crash and still went broke five years later. The story of Jesse Livermore, told on the real chart of the Dow.
Jesse Livermore thought the stock boom had gone too far and sold short in 1929. The Dow peaked at 381.17 on 3 September, fell 12.8% on 28 October and 11.7% more the next day, and by 13 November was down almost half. His profit is reported at about $100 million, though no exact record survives. By 1934 he was bankrupt.
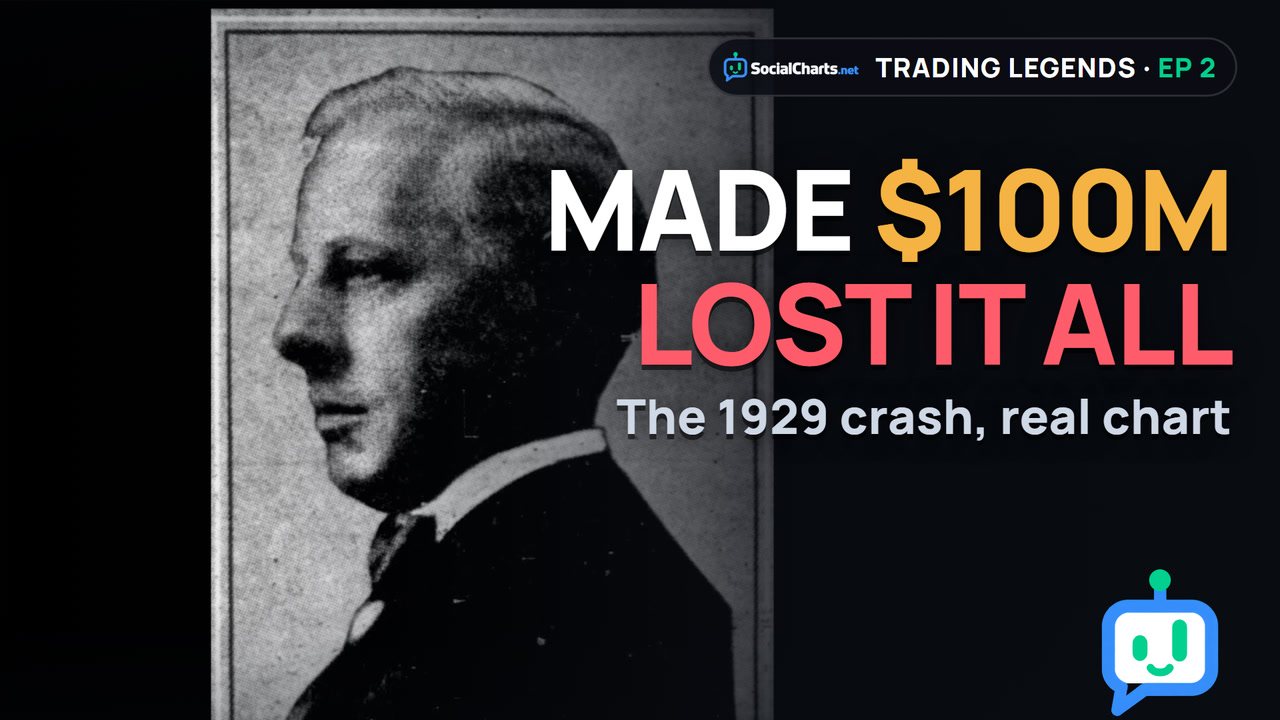
Thursday, 24 October 1929. Thousands of people crowd onto Wall Street. The stock market is falling, and the biggest banks in New York are trying to stop it. They can’t. On 28 and 29 October, the Dow Jones Industrial Average loses almost a quarter of its value.
Most investors lost fortunes. One man is said to have made about $100 million by betting on the fall, close to $2 billion in today’s money. His name was Jesse Livermore. Five years later, he was bankrupt.
The Boy Plunger
Livermore was born in Massachusetts in 1877. At fourteen, he left home for Boston. He found a job in a brokerage office, writing stock prices on a big chalkboard. All day he watched the numbers move, and he began to see patterns in them.
Soon he was betting on those prices in so-called bucket shops. You did not buy a stock there; you only bet on its price. He won so often that the shops banned him. They called him the Boy Plunger.
Fortunes won and lost
In 1907, a banking panic hit New York. Livermore sold stocks short, betting that they would fall. On one day in October, by his own account, his profits passed a million dollars. (Selling short is explained in Long vs Short.)
But money made fast can go fast. A year later he lost heavily in cotton. In 1915 he was declared bankrupt.
He came back. By the 1920s he was one of the best-known traders in America. He traded from a private office, with his own price board and his own clerks.
The crash of 1929
From the start of 1928 to September 1929, the Dow rose 87%, from 203.35 to 381.17. Everyone seemed to be buying, often with borrowed money. Livermore thought the rise had gone too far, and he began to sell short.
On 3 September 1929 the Dow peaked at 381.17. Then it began to slip. On Thursday 24 October, panic broke out, and the Dow closed at 299.47. The next Monday, 28 October, it fell 12.8%. On Tuesday, 11.7% more. The next morning, the crash filled the front page of The New York Times. By 13 November the Dow was at 198.69, down almost half from its peak.
| Date | Dow close | What it means |
|---|---|---|
| 3 Jan 1928 | 203.35 | Start of 1928 |
| 3 Sep 1929 | 381.17 | Peak: +87% since January 1928 |
| 24 Oct 1929 | 299.47 | Black Thursday |
| 28 Oct 1929 | 260.64 | −12.8% in one day |
| 29 Oct 1929 | 230.07 | −11.7% in one day |
| 13 Nov 1929 | 198.69 | −48% from the peak |
| 17 Apr 1930 | 294.07 | Bounce: +48% from November |
| 8 Jul 1932 | 41.22 | Bottom: −89% from the peak |
Dow Jones Industrial Average daily closes: MeasuringWorth (Samuel H. Williamson), DJA series. The 28 October fall is measured from the Saturday close on 26 October.
Livermore’s short positions reportedly made him about $100 million. There is no exact record, but that is the number that has followed his name ever since.
The fall
He was now enormously rich. But the market did not go straight down. In April 1930 the Dow bounced back to 294.07. Then it fell, and kept falling, to 41.22 on 8 July 1932: 89% below the peak.
Somewhere in those years, Livermore’s fortune disappeared. Nobody knows exactly how. In 1934 he was bankrupt again. TIME reported his debts at about $2.26 million and his assets at about $185,000.
In 1940 he published a book on how to trade. Later that year he took his own life in a New York hotel. He was 63.
What traders can learn
His story lives on in a 1923 book based on his life, Reminiscences of a Stock Operator. One line from it is still quoted by traders: “It never was my thinking that made the big money for me. It was always my sitting.”
- Being right is not enough. Livermore was right in 1907 and in 1929, and still went broke more than once.
- Big wins tempt bigger bets. One large losing trade can wipe out years of gains.
- The market repeats itself. As the book says: “Whatever happens in the stock market to-day has happened before and will happen again.”
Being right about the market does not protect your account. The size of each bet affects whether one mistake can wipe out years of gains.
Many buyers in 1929 used borrowed money. To see how borrowing changes the size of gains and losses, read Leverage and Margin and How to Size a Position. For another trader who bet against the crowd, see George Soros and Black Wednesday.
Frequently asked questions
How much did Jesse Livermore make in 1929?
About $100 million is the figure usually reported, close to $2 billion in today’s money. No exact record survives.
How did Livermore profit from the crash?
He sold stocks short, betting that prices would fall. The Dow fell from 381.17 on 3 September 1929 to 198.69 on 13 November.
How much did the Dow fall in 1929?
It fell 12.8% on 28 October and 11.7% on 29 October. By 13 November it was 48% below its peak, and by 8 July 1932 it was 89% below it.
Why did Livermore go bankrupt?
Nobody knows exactly how his fortune disappeared. In 1934 TIME reported his debts at about $2.26 million and his assets at about $185,000.
What book is based on Jesse Livermore’s life?
Reminiscences of a Stock Operator, by Edwin Lefèvre, published in 1923.
Compare a big day today
Open gold on the daily chart and find its largest one-day fall of the past year. Compare it with the Dow’s 12.8% on 28 October 1929.
Keep learning
 Chart School · 4Do Candlestick Patterns Work? We Tested 3,024 on Real Charts
 Trading Terms · 3What Is a Lot in Forex and Gold? Lot Size and Pip Value
 Gold Playbook · 3What Happens to Gold on Fed Days? 12 Real Rate Decisions, Measured
Educational content only, not investment advice. Trading CFDs and forex involves a high risk of losing money.