Do Candlestick Patterns Work? We Tested 3,024 on Real Charts
Engulfing candles, pin bars and inside bars are the most popular signals on any chart. We counted more than 3,000 of them and checked what price did next.
Not on their own. We found 3,024 engulfing candles, pin bars and inside bars on gold and EURUSD daily and 4-hour charts (2024–2026). Five candles later, price had moved the pattern’s way 49% of the time: about a coin flip. Popular filters stayed close to 50%. What a pattern does give you is a clear price where your idea is wrong.
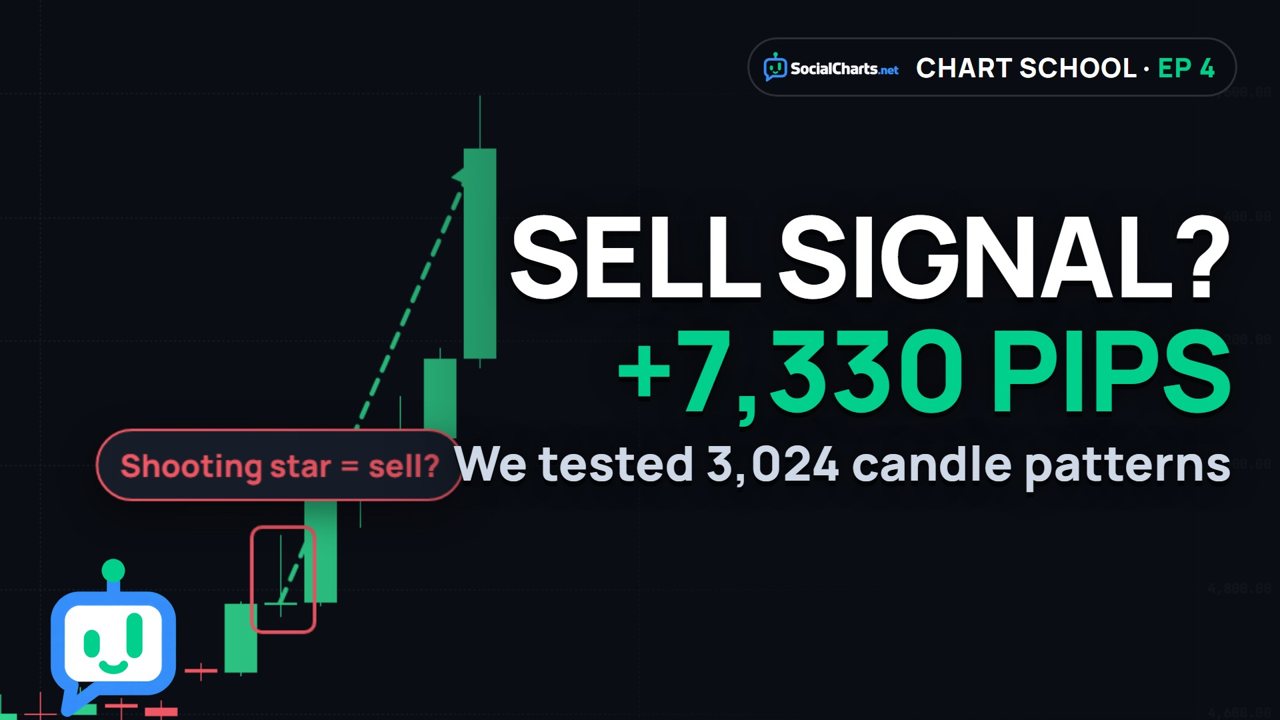
This is gold in January 2026. On January 21, it printed a candle that trading books call a sell signal: a shooting star. A long wick on top, and almost no body. Buyers pushed price up $112, then sellers pushed it back near the open. Was the book right? Over the next five candles, gold rose $733.
So do candle patterns work? We did not guess. We counted more than 3,000 of them, on real charts.
What a candle pattern is
First, a quick reminder from How to Read Candlestick Charts. Every candle is a fight. The body shows who won the period. The wicks show where one side pushed, and lost.
A candle pattern is that fight, told in one or two candles. Traders give these shapes names, and many trade them as signals. Here are the three most popular ones.
Engulfing candles
An engulfing candle is a candle whose body covers the whole body of the candle before it, which had the opposite color.
Two days in August 2026: on the 17th, gold printed a green candle. On the 18th, a red candle whose body covered the whole green body. The story: buyers won one day, then sellers took all of it back, and more. The textbook says price should fall.
It did not. The next day, gold jumped $179. By August 24, it closed $347 above the red candle’s close, at 4,679.94.
Now an example that worked. On March 24, 2026, after a hard fall, a green candle covered the red body before it. The textbook says buy. Five candles later, gold was $150 higher.
Same pattern. Opposite results.
Pin bars
A pin bar is a candle with one long wick and a small body at the other end.
On March 23, 2026, gold dropped $367 during the day, from 4,464.62 to 4,097.51. Then buyers pushed it back, almost to where it opened: it closed at 4,440.62. A long lower wick says: sellers tried, and lost. This kind of pin bar is called a hammer. It is the same candle as the wick-through in How to Identify a Trend. And it worked: five candles later, gold was $72 higher.
The mirror image, with a long wick on top, is called a shooting star, like the January 21 candle from the start of this lesson. It said sell, in the middle of a strong uptrend. Gold rose $733. Remember this one: we come back to why it failed.
Inside bars
An inside bar is a candle whose high and low both stay inside the candle before.
On November 5, 2025, gold traded inside the range of the day before: a high of 3,990.25 and a low of 3,929.56. Neither side could break out. The market is making up its mind, so traders watch which side breaks first. Here, the next day broke the top, and price kept going. By November 12, gold closed at 4,190.72.
The test: 3,024 patterns
So which candles can you trust? We tested it.
- Markets: gold (XAUUSD) and EURUSD.
- Charts: daily candles from June 2024 and 4-hour candles from January 2025, both to October 2026.
- Patterns: a computer found every engulfing candle, pin bar and inside bar.
- One question: five candles later, had price moved the pattern’s way?
| Pattern | Found | Right after 5 candles |
|---|---|---|
| Engulfing | 997 | 52% |
| Pin bar | 786 | 47% |
| Inside bar | 1,241 | 49% |
| All patterns | 3,024 | 49% |
A pin bar here has one wick at least twice the body and at least 60% of the candle, and the other wick at most 20%. An inside bar has no direction of its own, so its color was used.
Engulfing candles were right 52% of the time. Pin bars, 47%. Inside bars, 49%. All together: 49%. That is a coin flip.
We also tried the usual tips: only patterns near a recent low or high, only patterns the next candle confirmed, only patterns with the trend. Each one stayed close to 50%.
On its own, a pattern is a coin flip. None of the popular filters moved the result far from 50%.
The base rate trap
There is a trap. Gold climbed a lot over this period: from about 2,350 in June 2024 to about 4,000 in October 2026. Pick any day at random, and five candles later gold was higher 58% of the time. That is called the base rate: what happens anyway, with no pattern at all.
So on gold, buy patterns looked good, and sell patterns looked bad. On gold’s daily chart, buy patterns were right 58% of the time, the same as the base rate, and sell patterns only 38%. The shooting star of January 21 was one of those sell patterns. The trend did the work, not the candles.
Always ask: compared with what? A result above 50% means little if price went that way 58% of the time anyway.
How to use them
So should you forget candle patterns? Not at all. But a pattern asks a question. The next candles answer it.
- Look for them at your levels. A pattern at one of your support and resistance zones is where the question really matters.
- Be careful with signals against a strong trend, like that shooting star in January.
- The wick shows where you are wrong. This is the most useful part.
Take the March 23 hammer. A buy idea based on it would be wrong if price fell below its low of 4,097.51. This shows how a wick can define a stop-loss level. Three days later, on March 26, gold dipped again, to 4,297.44, but it stayed above the wick. Price had not crossed that level. By April 1, gold was near 4,800.
How much should you risk on an idea like this? That is the next question, and it has its own lesson: position size.
Recap and practice
- A pattern asks a question.
- Look for it at your levels.
- Be careful against the trend.
- The wick shows where you are wrong.
Practice: open EURUSD on SocialCharts, switch to the daily chart, and find the last engulfing candle or pin bar. Then watch the next five candles. Did they agree?
Frequently asked questions
Do candlestick patterns work?
Not on their own. In our test of 3,024 engulfing candles, pin bars and inside bars on gold and EURUSD, price moved the pattern’s way five candles later 49% of the time, about a coin flip.
Which candlestick pattern is the most reliable?
In our test none stood out. Engulfing candles were right 52% of the time, inside bars 49% and pin bars 47%. All of them are close to 50%.
Does waiting for confirmation help?
Not much. Patterns that the next candle confirmed were right 50.1% of the time, against 49.2% for all patterns.
What is the base rate?
What happens anyway, with no pattern at all. On gold’s daily chart from 2024 to 2026, price was higher five candles later 58% of the time, so buy patterns looked good simply because gold was rising.
Are candle patterns useless, then?
No. A pattern asks a question that the next candles answer, it matters most at your support and resistance zones, and its wick gives you a clear price where your idea is wrong.
Test a pattern yourself
Open EURUSD on the daily chart, find the last engulfing candle or pin bar, and watch the next five candles. Did they agree?
Keep learning
 Trading Terms · 3What Is a Lot in Forex and Gold? Lot Size and Pip Value
 Gold Playbook · 3What Happens to Gold on Fed Days? 12 Real Rate Decisions, Measured
 Trading Legends · 1How Did George Soros Break the Bank of England on Black Wednesday?
Educational content only, not investment advice. Trading CFDs and forex involves a high risk of losing money.